
Figure 6.
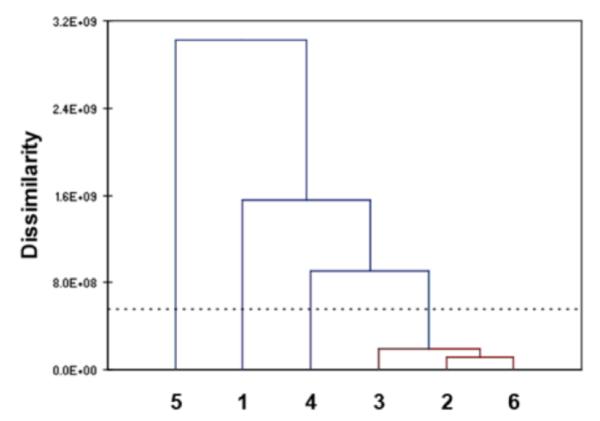
AHC dendrogram of oligomers 1-6 based on their responses (difference spectra profile data) to all the metal ions. The sensors are categorized according to their overall response dissimilarity: grouped together based on the level of dissimilarity. Sensors exhibiting mostly similar response pattern (low level of dissimilarity, red colored lines) to all eight metal cations can be grouped into one class. The vertical lines correspond to the different classes, and the horizontal lines to the dissimilarity values between the classes.