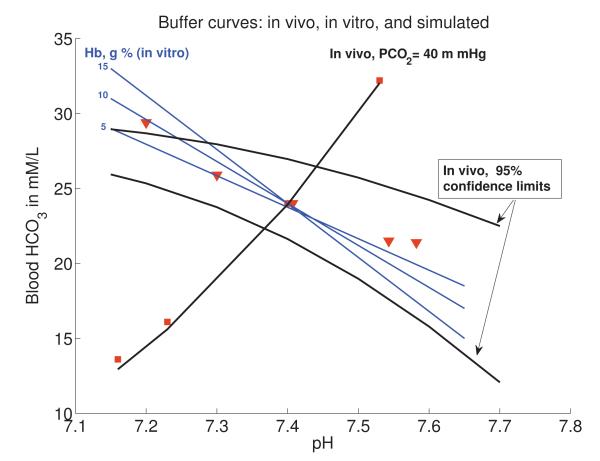
Figure 5.
Human buffer curve comparison between in vitro, in vivo, and calculated with our model. Blue lines represent in vitro curves of blood containing varying amounts of haemoglobin. Dark black lines are the in vivo observed ranges in values for a normal human. Red squares and triangles represent calculated values when Equations (9)-(14) are solved with initial conditions (16) and parameters as in Table 1 but with varying ξ3 to simulate impaired ventilation, and varying θ1 to simulate ingestion or loss of bicarbonate. Red squares represent inducing a metabolic disturbance by varying (θ1) with a constant pCO2 level (40 mm Hg). The accuracy of the mathematical model, particularly with regards to metabolic alkalosis, is encouraging. Red triangles represent the effect of varying CO2 through disordered ventilation. These data points were obtained by fixing ventilation rate, ξ3, at several values, running the simulations as in Figure 3, and taking the blood CO2, , and pHe values prior to renal compensation consistent with experiments. Although this model does not focus on respiratory disturbances, it still provides a good fit to data in this region, particularly in the region of interest where blood pHe is in the normal and safe region of 7.35-7.45. In vitro and in vivo data adapted with permission from The University of Chicago Press (Figures 17 and 18 in [18]).

