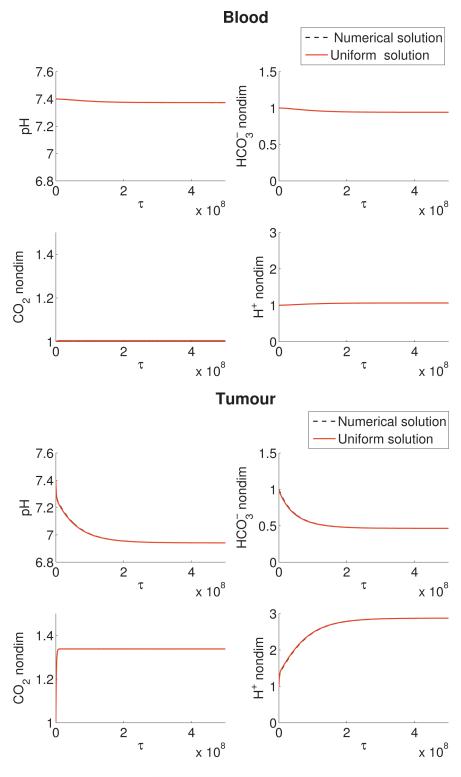
Figure 6.
Comparison of the numerical (black dashed line) and uniform analytical approximation (red line) in the (a) blood and (b) tumour in an untreated human. The uniform analytical solution is calculated from Equation (77). The numerical solution is simulated with Equations (9)-(14). All numerical and analytical solutions are calculated with initial conditions (16) and parameters from Table 1 but with θ1 = 0.

