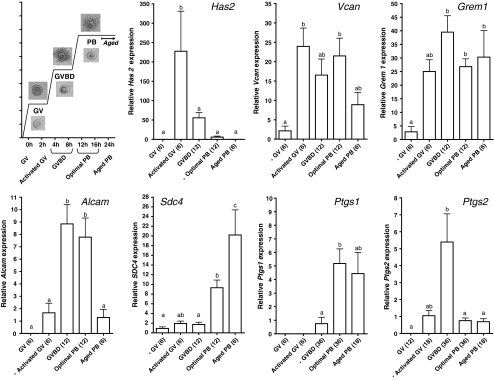
Fig. 3.
The relative expression observed in cumulus cells from eCG primed mice at different time points post hCG injection. The first graph depicts the source of the material and the type of oocyte it surrounded. Magnification of the pictures is 300× for cumulus oocyte complexes and 400× for the oocytes. The succeeding graphs depicts the relative expression level (Mean + SEM) of each of the genes with the condition used as calibrator marked with an *. Conditions marked with different letters are statistically different after two-tailed ANOVA and the Tukey post test (P < 0.05)

