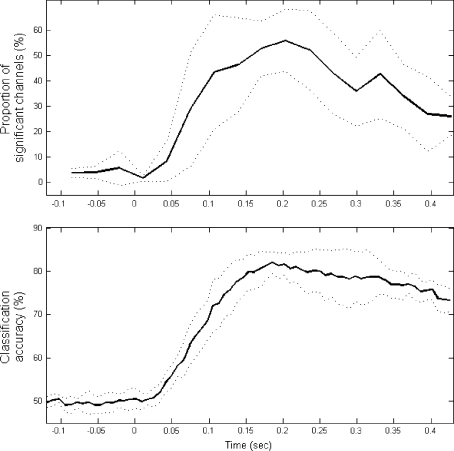
Fig. 4.
Top: Grand mean of the percentage of channels with P > 0.95 (defined by Eq. 5) across subjects over 17 time windows. The cue is presented at 0 s. Bottom: Overall mean of classification accuracy from the single trial analysis using FC (described in part 1 and 3 of the “Data analysis” section). For both panels, dotted lines denote inter-subject standard deviations

