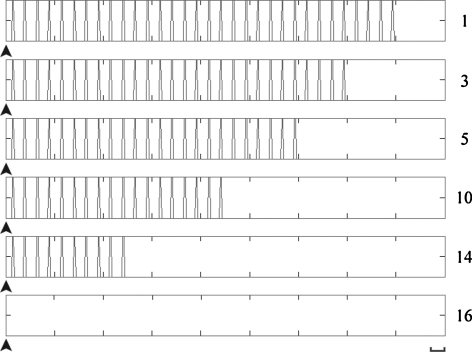
Fig. 3.
Activity of the CA1 neurons in reaction to the 1st (1.row) to 16th (last row) stimulus. The number of subsequent stimuli is indicated on the right. The attenuation of firing behaviour in our simulation [as well as in-vivo (Vinogradova 2001)] is clearly related to the sequential number of presented stimuli. Timebase indicated on right floor is ca. 200 ms; the small arrows indicate the stimulus onset

