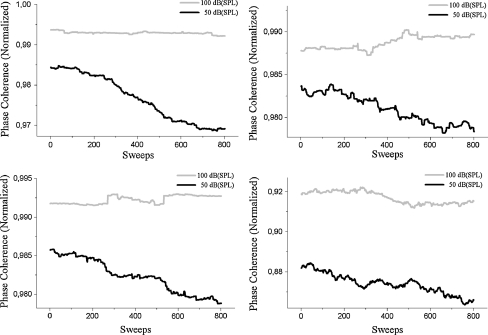
Fig. 6.
Figures show exemplary the results of the habituation experiments for four different subjects. The light grey curve depicts the normalized phase coherence over 800 stimuli for a stimulation level of 100 dB (SPL) (as described in Data analysis), the black curve indicates the same for a stimulation level of 50 dB (SPL)

