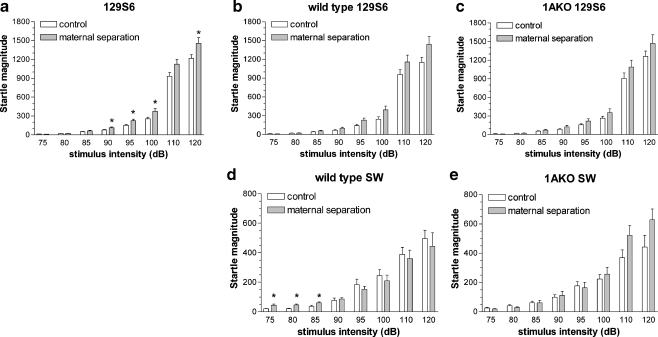
Fig. 1.
Acoustic startle response. Mean startle magnitude (in arbitrary units ± SEM) as a function of startle stimulus intensity in 129S6 (a, b, c) and SW mice (d, e), exposed to AFR (control, white bars) or MS (gray bars). Panel a shows the effects on wild-type and 1AKO 129S6 together, as the effects of MS were independent of genotype. Panels b–e show the effect of MS for the separate genotypes. Differences between wild-type and 1AKO mice can be inferred by comparing the white bars in panels b and c for 129S6, and white bars in panels d and e for SW. * p < 0.05 relative to corresponding control

