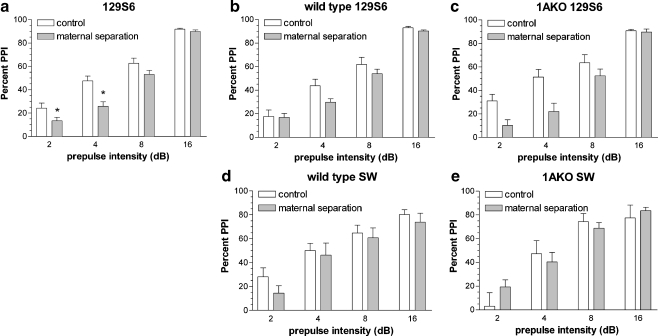
Fig. 3.
PPI of the acoustic startle response. Effect of MS (gray bars) on percent PPI measured at different prepulse intensities, in 129S6 (a, b, c) and SW mice (d, e). White bars show the response of AFR mice (control, white bars). In panel a, the effects on wild-type and 1AKO 129S6 mice are taken together, as the effects of MS were independent of genotype. Panels b–e show the effect of MS for the separate genotypes. Differences between wild-type and 1AKO mice can be inferred by comparing the white bars in panels b and c for 129S6, and white bars in panels d and e for SW. Pearson’s correlation showed that startle magnitude and mean PPI levels were not correlated (r = -0.17, NS, n = 63). Data represent means ± SEM. *p < 0.05 relative to corresponding control

