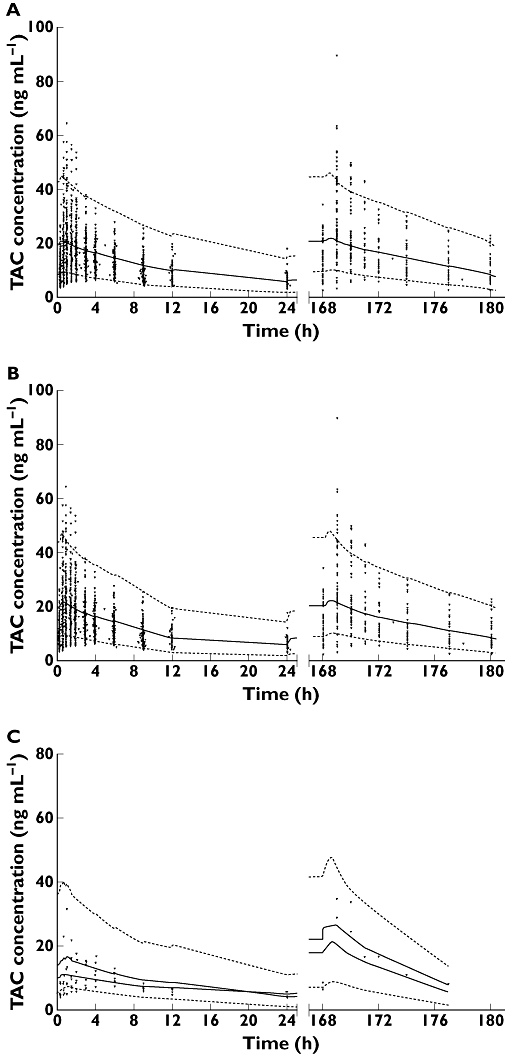
Figure 4.

Evaluation of the final model using a visual predictive check. Shown are comparisons between the observed data (circles) for tacrolimus (TAC) concentrations and the 5th (bottom dashed line), 50th (solid line) and 95th (top dashed line) percentiles obtained from 1000 simulations for the global population standardized to a 4.25 mg dose (A), and as a function of CYP3A5 status, standardized to a 4.13 mg dose for non-expressers (B) and to a 6.88 mg dose for expressers (C)
