
Figure 2.
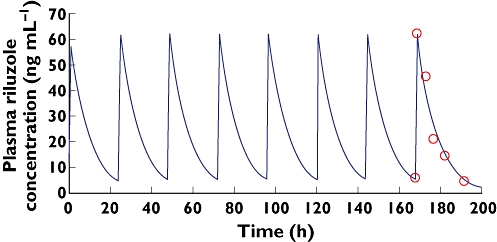
Plot of time course of riluzole plasma concentrations in a typical subject after oral administration of 50 mg once daily. Solid lines represent the pharmacokinetic curve predicted by the one compartment model with zero order absorption. Observed ( ); Predicted (
 )
)