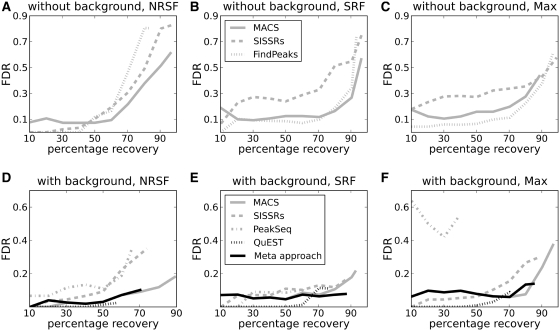
Figure 2.
Performance of the different programs in the manually evaluated regions for the three transcription factors NRSF (A and D), SRF (B and E) and Max (C and F). The plots show how the FDR increases with percentage recovery of true peaks. Note the difference in scale on the FDR-axes for plots (A–C) compared to (D–F). Plots (A–C) show results when no background data is used in the analysis, whereas D–F show results when additional background data is included. The latter plots also show results from the meta-approach described in this study.

