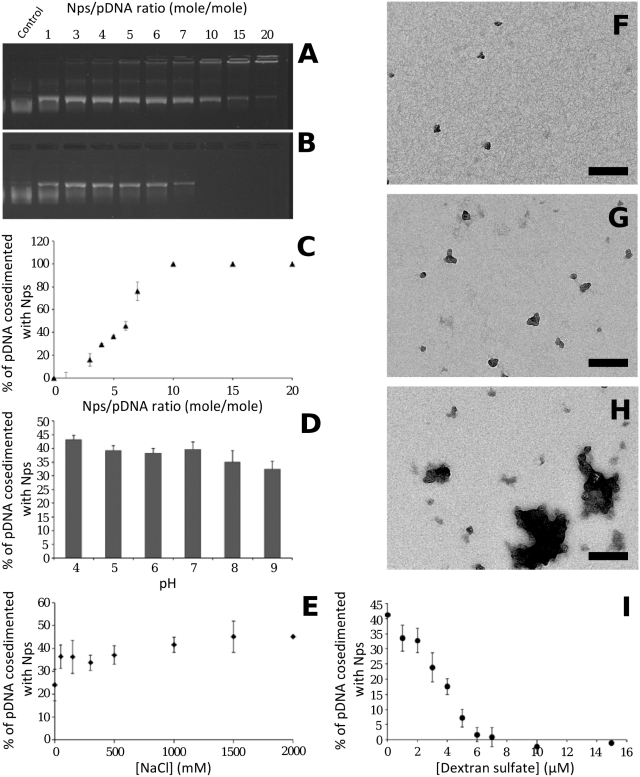
Figure 2.
Physicochemical characterization of Np/pDNA interactions. (A) Agarose gel electrophoresis of Np/pDNA complexes prepared at the ratio (r) given on top. (B and C) After centrifugation, gel electrophoresis of the supernatant (B), and pDNA cosedimented with Np plotted in (C). (D) Influence of pH on Np/pDNA complexes at r = 5. (E) Influence of NaCl on Nps/pDNA complexes at r = 5. (F–H) TEM images of Np/pDNA complexes at r = 1, r = 5 and r = 10, respectively. (I) Influence of polyanion (dextran sulphate; 500 000 kDa) on complexes stability. Scale bar 200 nm.

