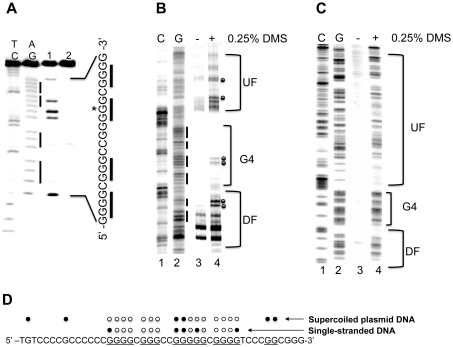
Figure 2.
(A) DMS footprinting of the VEGF G-rich single strand in the presence of 100 mM KCl. AG and TC lanes represent purine and pyrimidine- specific Maxam–Gilbert sequencing reactions, respectively. Lanes 1 and 2 correspond to the G-rich strand DMS treated and untreated, respectively. (B and C) Autoradiogram showing DMS modification sites on the G-rich strand of a supercoiled (B) or linearized (C) form of pGL3-VEGF plasmid. Lanes 1 and 2 represent respective cytosine and guanine-specific dideoxysequencing reactions using the same primer as for the extension reactions. Lanes 3 and 4 correspond to the pGL3-VEGF plasmids that are untreated and treated with DMS (0.25%), respectively. Each band reflects extension reaction products of a gene specific primer designed to anneal to the G-rich strand of the plasmid DNA to map the DMS modification sites on the same strand. The bracket ‘G4’ represents a proposed G-quadruplex-forming region and brackets ‘UF’ and ‘DF’ represent the up- and downstream flanking regions of the G-quadruplex-forming sequence. (D) Summary of the results from both DMS footprinting experiments. The DMS-protected guanine residues within the G-rich sequences of the VEGF promoter are indicated by open circles, and closed circles indicate the guanine residues methylated by DMS. Data shown are representative of at least two experiments.

