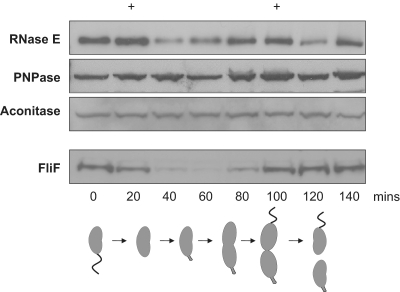
Figure 6.
Cell-cycle variation of RNase E. (Top) Representative western blots of RNase E, PNPase, aconitase and FliF protein abundance during the cell division cycle. The two maxima of RNase E abundance are marked at the top with +. (Bottom) Cartoon representation of the stages of C. crescentus cell division.

