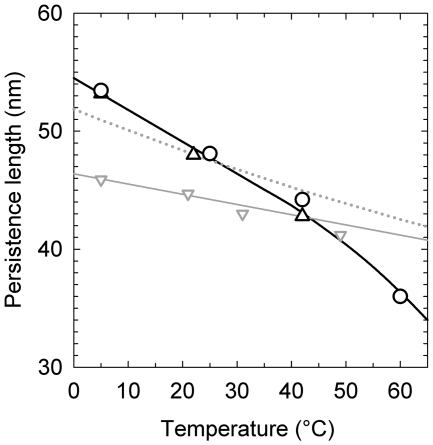
Figure 7.
The temperature dependence of DNA persistence length. The data obtained from the measurements of j-factors (open triangle) and the variance of  (open circle) in the current study are shown together with Equation (1) (dotted gray line) and the data from reference (12). The solid line represents manual interpolation of the current results.

