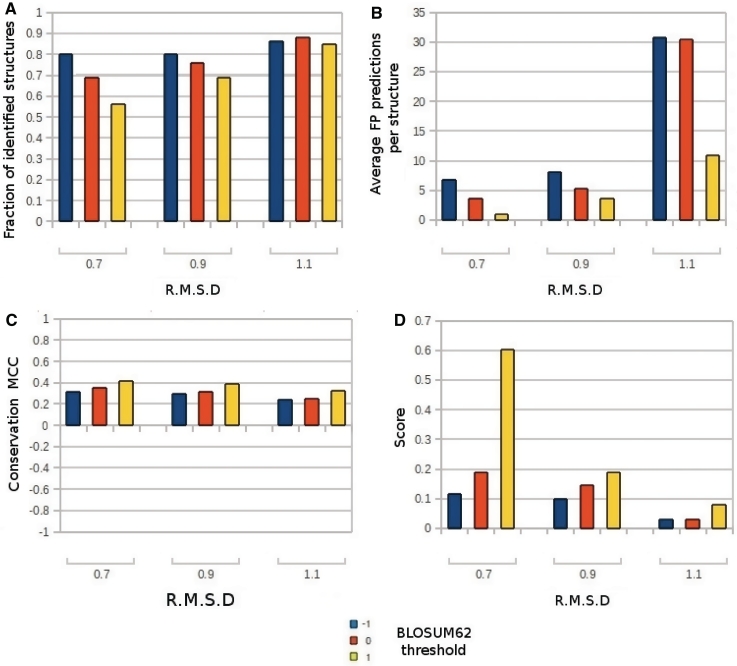
Figure 2.
Results obtained on the protein structures of the training set. Each bar in the graphs represents the results for a different combination of RMSD and substitution parameters used. The RMSD threshold is reported on the X-axis, while different colors show the BLOSUM62 threshold. (A) Percentage of analyzed structures having at least one correctly predicted PbS. (B) Average number of FP predictions produced per structure. (C) Matthews Correlation Coefficient (MCC). (D) Final score. The score is the fraction of identified proteins divided by the average number of FP predictions per structure.

