Table 2.
Enzyme Inhibition and Whole Cell Data of Ethylenediamine-Based FTIs Exhibiting a Range of R2 Sulfonyl Groups
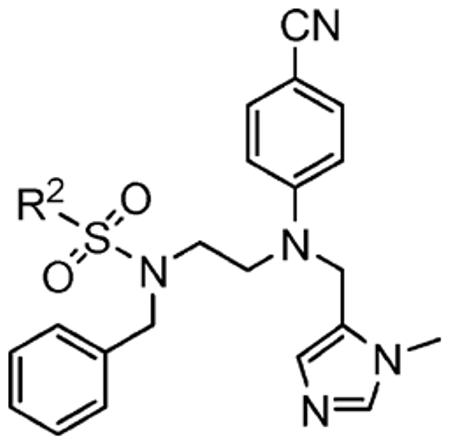 | ||||||
|---|---|---|---|---|---|---|
| Compound | IC50 (nM) | Selectivity | Processing IC50 (μM) | |||
| Number | R2 | hFTase | GGTase-I | H-Ras | Rap1A | |
|
1a (FTI-2585) |
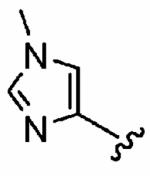
|
56 ± 29 | 2700 ± 2200 | 48 | 1.9 ± 1.2 | >10 |
|
1b (FTI-2640) |

|
48 ± 35 | 4100 ± 1700 | 85 | 0.07 | >10 |
|
1c (FTI-2644) |

|
85 ± 0.7 | 5500 ± 2700 | 65 | NDa | ND |
|
1d (FTI-2592) |
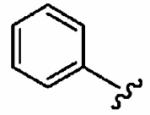
|
41 ± 26 | 310 ± 50 | 7.6 | 0.3 ± 0.1 | >10 |
|
1e (FTI-2589) |
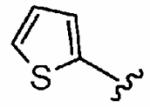
|
50 ± 13 | 10,000 | 200 | 0.5 ± 0.2 | >10 |
|
1f (FTI-2587) |
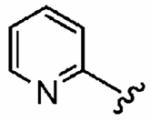
|
25 ± 20 | 820 ± 240 | 113 | 0.09 ± 0.06 | >10 |
|
1g (FTI-2590) |
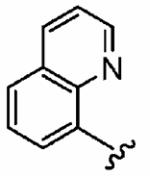
|
30 ± 14 | 10,000 | 333 | 0.6 ± 0.3 | >10 |
|
1h (FTI-2591) |
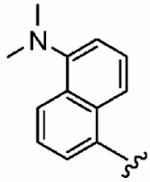
|
160 ± 110 | 10,000 | 63 | 1.5 ± 0.3 | >10 |
ND = not determined.
