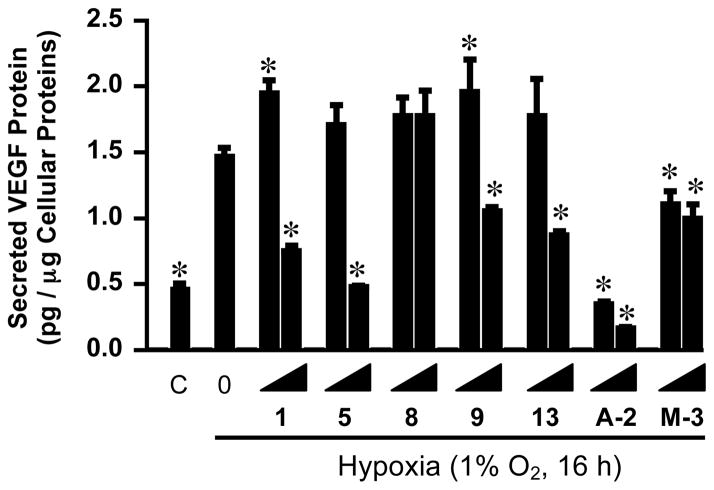
Figure 3.
Concentration-dependent effects of compounds 1, 5, 8, 9, 13, A-2, and M-3 on the hypoxic induction of secreted VEGF protein. T47D cells were exposed to hypoxic conditions (1% O2, 16 h) in the presence of compounds at the incrementing concentrations of 3 and 10 μM, respectively. Levels of VEGF in the conditioned medium samples were determined by ELISA and normalized to the amount of cellular proteins. The sample “C” represents normoxic control, while “0 under Hypoxia” stands for the medium control under hypoxic conditions. Data shown are average + standard deviation from one experiment performed in triplicate. The asterisk “*” indicates that the difference between the specified sample and the hypoxic media control is statistically significant (p < 0.05).

