Figure 4.
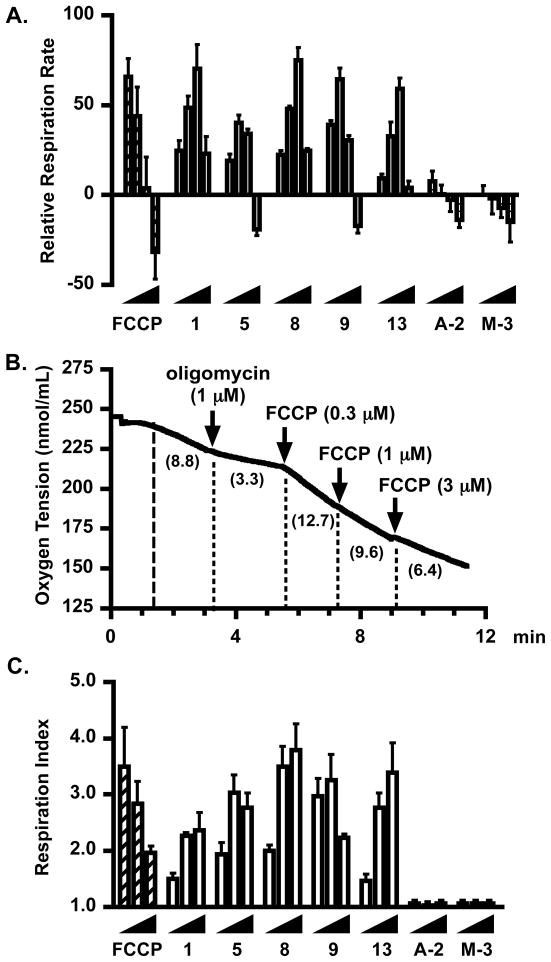
Effects of compounds 1, 5, 8, 9, 13, A-2, and M-3 on cellular respiration. (A) Concentration–response results of 1, 5, 8, 9, 13, A-2, M-3, and the uncoupler standard FCCP on oxygen consumption in T47D cells. All compounds were tested at the incrementing concentrations of 0.3, 1, 3, and 10 μM. Oxygen consumption rates were determined and presented as Relative Respiration Rate, in comparison to the untreated control. Data show are average + standard deviation from three independent experiments. (B) Oxygen concentrations in the presence of respiring T47D cells, oligomycin (1 μM), and the uncoupler FCCP at the specified concentrations. (C) Concentration–response results of 1, 5, 8, 9, 13, A-2, M-3, and FCCP on state 4 respiration initiated by the addition of oligomycin. Test compounds were added at the incrementing concentrations of 0.3, 1, and 3 μM. Oxygen consumption rate data were presented as Respiration Index to compare the effects of compounds at stimulating state 4 respiration in T47D cells. Data show are average + standard deviation from three independent experiments.

