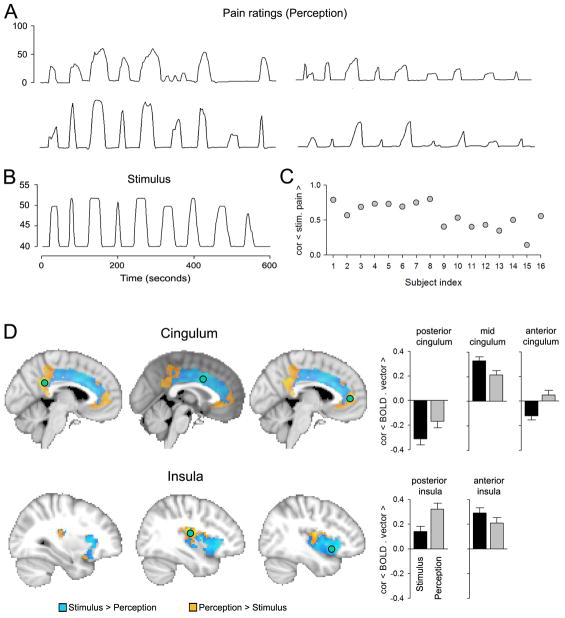
Figure 1.
Segregating the cingulate and insular cortices along the stimulus and subjective perception dimensions for acute thermal pain. A: Variability of subjective ratings of pain is illustrated for four subjects. B: Temporal and intensity properties for a constant thermal stimulus that was applied to the skin on the back. C: Variability of correlation between the stimulus and ratings for the 16 subjects in the study. D: Contrasting cingulate gyrus and insula activity between stimulus and perception identifies statistically significant regional differences in each area along these dimensions. Green circles are regions where activity was extracted and correlated either with the stimulus or individual subject perceptions, corresponding bar graphs are in the right, which indicate the sign and extent of difference between representation of stimulus and perception. Anterior cingulate and posterior insula are regions best related to pain perception. All data are derived from the study described in [10].

