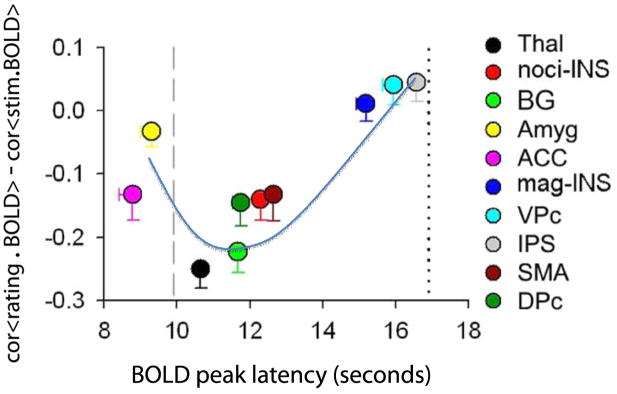
Figure 4.
Temporal sequence of brain activity for thermal painful stimuli determined in relation to anticipated peak for the stimulus (vertical line at 10 seconds from stimulus start) and actual reported peak of pain perception (vertical line at 17 seconds). Vertical scale is similarity of brain activity shape to the stimulus and perception shapes (negative values are better correlations to stimulus shape while positive values are better correlations to perception, determined for specific BOLD activity extracted for all regions listed on the right). The anterior cingulate (ACC) and amygdala (Amyg) peak at times prior to the stimulus peak, implying that these regions are more related to anticipation of impending pain. The thalamic activity (Thal) peaks just after the stimulus and best reflects stimulus shape. Nociceptive insula (noci-INS) and magnitude insula (mag-INS) are segregated by time and shape similarity, reflecting their respective functional labels. The blue curve approximates the brain spatio-temporal evolution of nociceptive information being transformed into subjective consciousness of pain. BG = basal ganglia; VPc = ventral prefrontal cortex; IPS = inferior parietal sulcus; SMA =supplementary motor area; DPc = dorsal prefrontal cortex. Adapted from [10].

