
Figure 6.

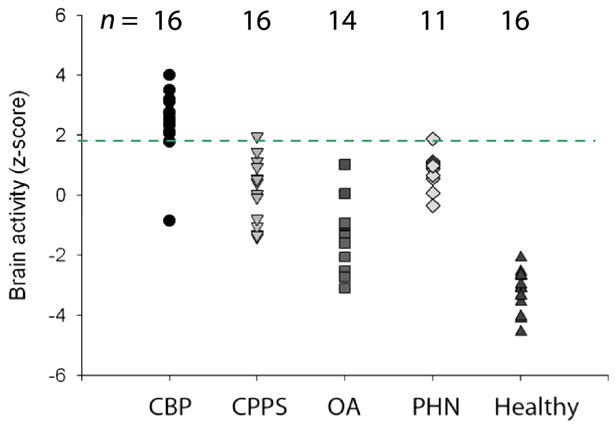
Figure 6A: Brain activity patterns for various clinical chronic pain conditions. Activity maps: are group-averaged responses for different pain conditions. Activity maps: Thermal pain, knee-pressure induced pain in healthy subjects, and in osteoarthritis patients (OA) show similar patterns of brain activity, implying that all three results correspond to acute pain activity. In contrast, brain activity for spontaneous pain in different clinical conditions (chronic back pain, CBP; osteoarthritis, OA; pelvic pain, CPPS; and post-herpetic neuralgia, PHN) show different activity patterns, engaging to different extents sensory and limbic brain areas. In PHN, tactile allodynia and spontaneous pain evoke relatively distinct brain regions too. Bar graphs: Magnitude of activity in 2 limbic regions (mPFC and Amygdala) and 2 sensory regions (thalamus and insula) are compared for four groups: healthy subjects for thermal pain, Healthy th; chronic back pain patients for spontaneous pain, CBP sp; post-herpetic neuralgia for spontaneous pain, PHN sp, and for tactile allodynia, PHN al). Thermal pain and PHN allodynia show larger activity in the sensory regions, while spontaneous pain in CBP and PHN evoke more limbic activity.
Figure 6B: Brain activity in medial prefrontal cortex (mPFC) shows high specificity for chronic back pain. Magnitude of mPFC regional activity (as identified in chronic back pain patients) across five groups of subjects. Each symbol is an individual subject. The threshold indicated by broken green line distinguishes chronic back pain (CBP) from pelvic pain (CPPS), osteoarthritis (OA), post-herpetic neuralgia (PHN) for spontaneous pain, and healthy subjects for acute pain (healthy) at an accuracy > 90%. The number of subjects studied in each group is indicated above.