
Fig. 6.
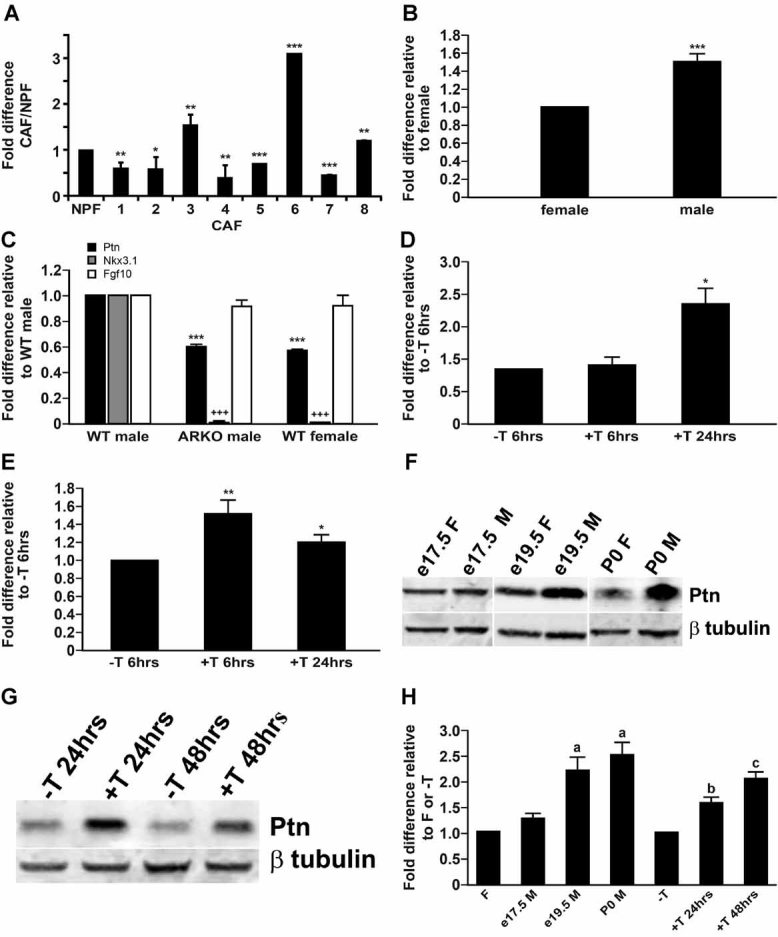
Expression of PTN mRNA in CAFs versus NPFs, male versus female urethra, and regulation by androgens. Panel A: The expression of PTN mRNA showed a decrease in CAFs compared to NPFs in five of eight CAF/NPF pairs, when quantified by qRT-PCR. Panel B: qRT-PCR analysis of PTN mRNA expression in human embryonic male and female urethra/UGT (15–18 weeks). The embryonic male UGT is exposed to significantly higher levels of circulating testosterone, produced by the fetal testes, than the embryonic female UGT 48. PTN mRNA levels were ∼1.5-fold higher in the embryonic male versus female UGT. Panel C: Quantitative PCR for Ptn mRNA in the UGT of male mice, ARKO male mice and female mice. ARKO mice lack AR and are a model for androgen action; they develop testes but lack secondary sex accessory tissues. Ptn mRNA was less abundant in ARKO males and wt females compared to wt males. NKx3.1, an epithelial marker of prostate identity which is known to be regulated by androgens, was included as a control and showed a marked reduction in level between wt males and ARKOs males or wt females. Fgf10, a ligand expressed in the stroma, showed no change between wt males, ARKO males, or females, suggesting that it is not androgen-regulated and that the mesenchymal composition between these samples is similar. Panel D: qRT-PCR analysis of rat VSUs grown ± testosterone for 6 and 24 hr; testosterone increased Ptn mRNA levels by twofold at 24 hr but not at 6 hr. Panel E: qRT-PCR for PTN mRNA in human embryonic prostate fibroblasts cultured in the absence of testosterone followed by 6 and 24 hr treatment with testosterone. PTN transcript expression increased in the presence of testosterone at 6 hr and was partially elevated at 24 hr. Panels F,G: Western blot analysis of Ptn (19 kDa) and β-tubulin (50 kDa); male and female rat UGT at e17.5, e19.5 and P0 (F), and VSU organs grown in the presence or absence of testosterone for 24 and 48 hr (G). β-tubulin was used as the loading control and for normalization. Panel H: Quantification of Western blot analysis in panels F and G, showing fold difference in Ptn expression in VSU organs grown −T versus +T 24 and 48 hr; testosterone increased Ptn levels at 24 and 48 hr and a difference in Ptn expression between female versus male rat UGT (e17.5, 19.05, and P0). Panels A,B,D,E, Student's t-test; *P < 0.05, **P < 0.01, ***P < 0.001. Panels C,H: One-way ANOVA with TUKEY multiple comparison; (C) ***,+++P < 0.001, (H) b–dP < 0.001.