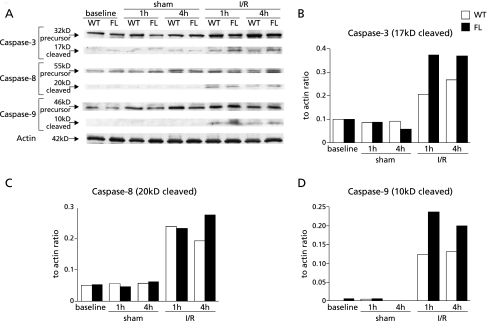
Fig. 2.
(A) Time course of precursor and cleaved caspase-3, -8, and -9 activation in the liver was assessed by western blotting in WT and FL mice. Samples were obtained from mice undergoing sham operation or ischemia/reperfusion (I/R). To ascertain that there was equal protein loading, the same samples were probed with anti-actin antibody. Each lane represents a sample from an individual animal. The results were quantitated to show the ratio of each of caspase-3 (B), -8 (C), and -9 (D) to actin as determined by an image analysis of an autoradiogram. The results are representative of two independent experiments.

