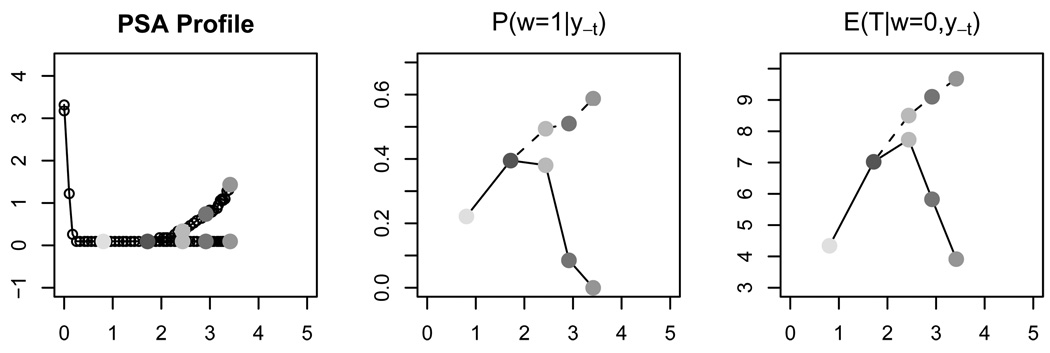
Figure 4.
The left panel plots the PSA profiles of two hypothetical patients from the AA arm. The horizontal axis is time in years from the initiation of treatment. Each point denotes a PSA measurement. The center panel shows the continuously updated posterior estimates of P(ω = 1 | y−t), where y−t denotes the PSA measurements up to the point marked by the corresponding grey shades in the left panel. The dotted(solid) line denotes the first(second) patient. The third panel shows the continuously updated posterior estimates of E(T | ω = 0, y−t).

