
Fig. 8.
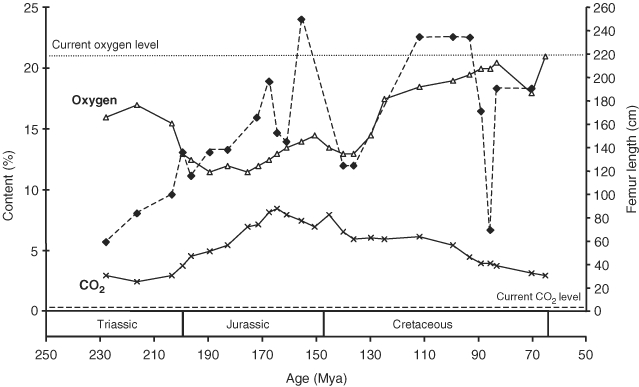
Variation of atmospheric composition(O2, CO2) and body size through time. Each data point is located at the beginning of a stage, starting with the Carnian and ending with the Cretaceous-Tertiary boundary. The variation of body size through time is an extension of the Carrano (2006) data set with femur length as a proxy for body size. Missing data points for body mass are either due to lumping of data from two stages (i.e. the Kimmeridgian and Tithonian) or missing data (i.e. for the Berriasian, Barremian, and Aptian). Body size increases gradually from the Late Triassic to the Late Jurassic, forming a plateau in the Cretaceous. The two sharp drops in body mass in the Early and Late Cretaceous are probably due to a poor terrestrial fossil record at these times. Note the lack of correlation between atmospheric composition and sauropod body mass. CO2content of the atmosphere also determines global temperature, and this graph thus suggests that sauropod body size is not correlated with global temperature variations through time, either. The data for O2 and CO2 levels are from Ward (2006).