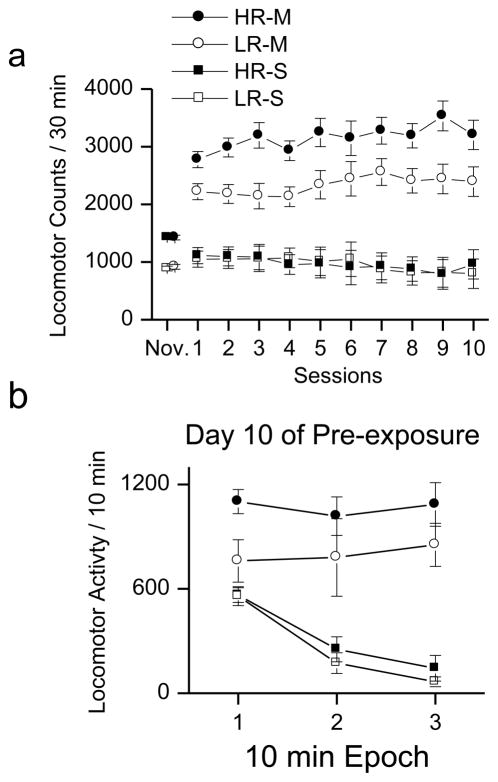
Fig 1. Locomotor activity and METH pre-exposure.
This plot illustrates the results of the response to novelty as measure in a 30 min locomotor test and the subsequent 10 test sessions of either METH or saline treatment. Closed symbols refer to animals classified as high responders (HR) and open symbols refer to low responders (LR). Circles indicate animals treated with METH, and squares indicate animals treated with saline. a: Animals treated with METH had more locomotor activity than saline treated rats. Although HR rats have a greater average response to METH than LR rats, this difference is not significant. There were no differences between HR and LR rats treated with saline. b: The data for the day 10 of METH or Saline treatment are plotted in 10 minute epochs indicating the within-session pattern of locomotor activity. Both HR and LR rats treated with saline showed significant within-session declines in locomotor activity. In contrast, rats treated with METH showed no within-session decline in locomotor activity. See text for detailed description.

