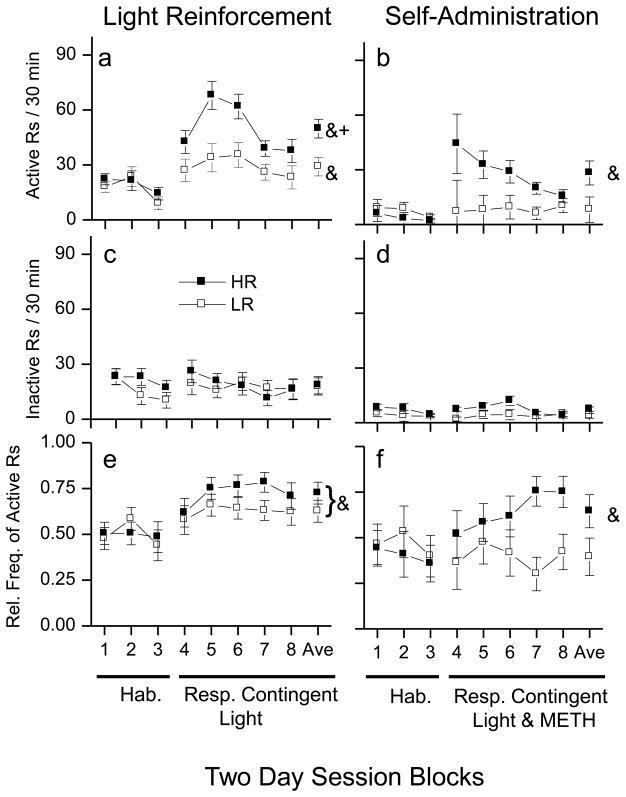
Fig 2. Light and METH reinforced responding.
These plots show the effects of a response contingent VS and VS&METH on snout poking following 6 days of habituation to a dark test chamber. The left panels show the data for response contingent VS phase. The right panels show the data for VS&METH combination phase. Closed square symbols refer to animals identified as high responders (HR) and open square symbols refer to low responders (LR). a&b: Data are illustrated as the average (±SEM) number of responses to the active alternative during each 30 minute session. (a) The response contingent VS increased active responding in both the HR and LR groups. The increase in active responding was significantly greater in the HR group compared to the LR group. (b) The response contingent VS&METH combination increased active responding in HR but not the LR rats. c&d: Data are the average (±SEM) number of responses to the inactive alternative during each 30 min test session. Neither the response contingent VS (c) or VS&METH combination (d) significantly effected responding to the inactive side. e&f: Data are the average (±SEM) relative frequency of active responding (active/(active + inactive)) during each 30 minute test session. (e)The response contingent VS increased the relative frequencies of active responding in both the HR and LR groups. (f) The response contingent VS&METH combination increased the relative frequency of active responding in HR rats but not LR rats. Ampersand (&) indicates a within group difference (p > 0.05) between the last two days of the habituation phase and average responding during response contingent VS testing. Plus (+) indicates a difference between the HR an LR groups (p > 0.05). See text for detailed description.

