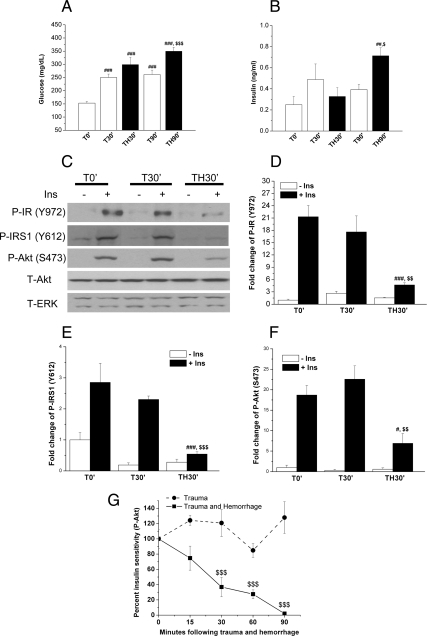
Fig. 1.
Characterization of hepatic insulin resistance after trauma and hemorrhage in mice. Mice were subjected to trauma alone (T) or trauma and hemorrhage (TH) as described in the Materials and Methods. A and B, At 0, 30, and 90 min, fasting glucose (A) and insulin (B) levels were measured from femoral arterial blood. Data are presented as mean ± sem of samples from nine to 10 mice in each group. In this and all the other figures, a single symbol (# or $) represents P < 0.05; a double symbol (**, ##, or $$) represents P < 0.01; a triple symbol (### or $$$) represents P < 0.001, and no symbol or ns represents not significant. #, Statistics vs. T0′; $, statistics vs. time-matched trauma alone. C, At 0 and 30 min, either saline (−Ins) or 1 U insulin (+Ins) was injected into the inferior vena cava of C57BL/6 mice. After 4 min, the liver was removed and frozen in liquid nitrogen. Liver tissue lysates were later prepared and subjected to Western blotting. D–F, Multiple autoradiographs were quantified by scanning densitometry. Data are presented as mean ± sem of samples from three to seven mice in each group. #, Statistics vs. T0′+Ins; $, statistics vs. T30′+Ins. G, Time-dependent decrease in insulin sensitivity in the liver after trauma and hemorrhage as measured by insulin's ability to induce Akt phosphorylation. Data are presented as mean ± sem of samples from three to seven mice in each group. $, Statistics vs. time-matched trauma-only group T30′, T60′, or T90′. # or $, P < 0.05; **, ##, or $$, P < 0.01; ### or $$$, P < 0.001; ns, not significant.

