Fig. 3.
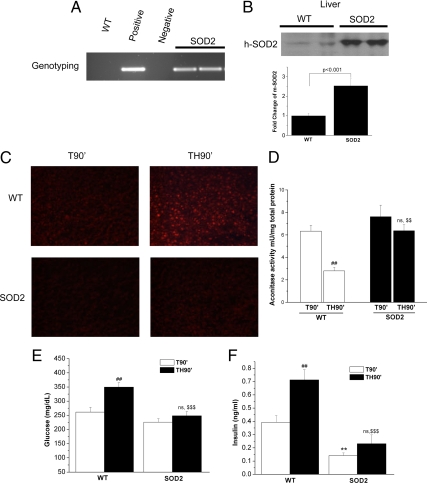
The effect of overexpression of SOD2 on ROS, aconitase activity, and blood glucose and insulin levels after trauma and hemorrhage. A and B, Genotyping (A) and Western blot analysis (B, top panel) were performed as described to confirm the overexpression SOD2 in transgenic mice as compared with WT mice. Positive and negative controls are presented for the PCR in A. Also in B is a bar graph of the total level of SOD2, using a mouse antibody that cross-reacts with both endogenous mouse SOD2 and expressed human SOD2. As described in Fig. 1, either trauma alone (T90′) or trauma and hemorrhage (TH90′) was performed in C57BL/6 (WT) or mice overexpressing SOD2. C and D, ROS levels were assessed by direct DHE staining in situ (C) (n =3) and by indirect measurement of aconitase activity (D) (n =6). E and F, Fasting blood glucose levels (E) (n = 8–11) and insulin levels (F) (n =5–7) were also measured in these mice. #, Statistics vs. WT-T90′; *, statistics vs. WT-T90′; $, vs. WT-TH90′; ns, not significant vs. SOD2–T90′. # or $, P < 0.05; **, ## or $$, P < 0.01; ### or $$$, P < 0.001.

