Fig. 4.
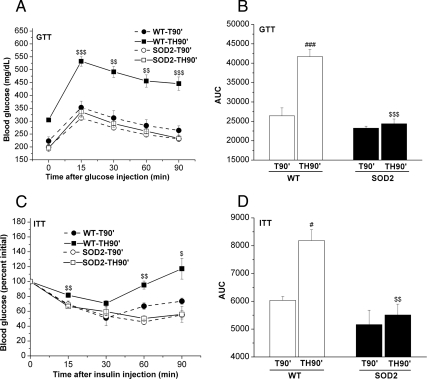
Overexpression of SOD2 increased glucose tolerance and insulin sensitivity after trauma and hemorrhage. WT mice or mice overexpressing SOD2 were subjected to trauma alone (T90′) or trauma and hemorrhage (TH90′) as previously described. However, in these mice, glucose tolerance tests (GTT) and insulin tolerance tests (ITT) were performed. A and B, In the glucose tolerance tests, after a 6-h fast, blood glucose was measured (the 0-min time point) after T90′ or TH90′, and then glucose (0.6 g/kg) was injected into the femoral vein, blood glucose levels were measured every 15 min (A), and the AUC were calculated as described (B). C and D, In the insulin tolerance tests, there was no fasting period, blood glucose was measured (the 0 min time point) after T90′ or TH90′, and then insulin (0.5 U/kg) was injected into the femoral vein, and blood glucose levels were measured (C) and analyzed (D). Data are presented as mean ± sem of three samples in each group. $, Statistics between WT-TH90′ and SOD2-TH90′; #, vs. WT-T90′. # or $, P < 0.05; ## or $$, P < 0.01; ### or $$$, P < 0.001.

