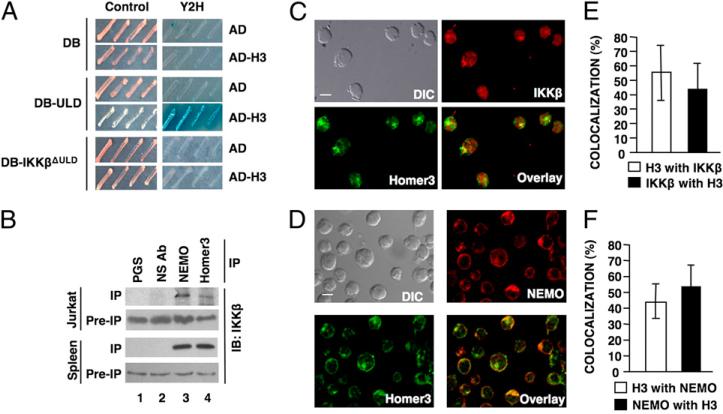
FIGURE 1.
Homer3 associates with IKKβ. A, Y2H interaction analysis using the AD alone or AD-H3 with either the DNA-DB alone, DB-ULD, or DB-IKKβΔULΔ. Growth in the Y2H plate (right panels) indicates an interaction. B, IPs from E6.1 Jurkat T cell or mouse splenocyte extracts were performed using PGS alone, NS Ab, anti-NEMO, or anti-Homer3. IP and pre-IP extracts were subjected to IB using anti-IKKβ. DIC images and confocal micrographs of resting Jurkat E6.1 cells showing localization of IKKβ (C) or NEMO (D) in red with Homer3 in green. Overlay of Homer3 with IKKβ or NEMO is shown (scale bar, 5 μm; original magnification ×60). E and F, Quantitative analysis of the percentage of Homer3 colocalized with either IKKβ or NEMO and the percentage of IKKβ or NEMO with Homer3. DIC, differential interference contrast; NS Ab, nonspecific Ab; PGS, protein G-Sepharose.

