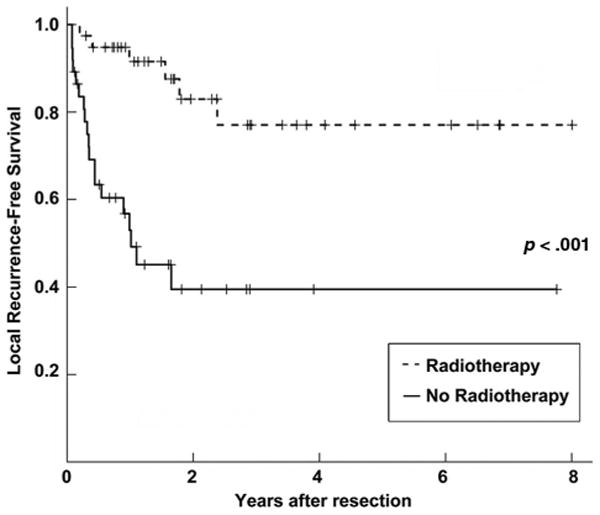
Figure 1.

Kaplan–Meier plot of local recurrence-free survival for all patients stratified by postoperative radiotherapy (PORT) use. The solid line represents patients who did not receive PORT, and the dashed line represents patients who received PORT.
