
FIG 2 .
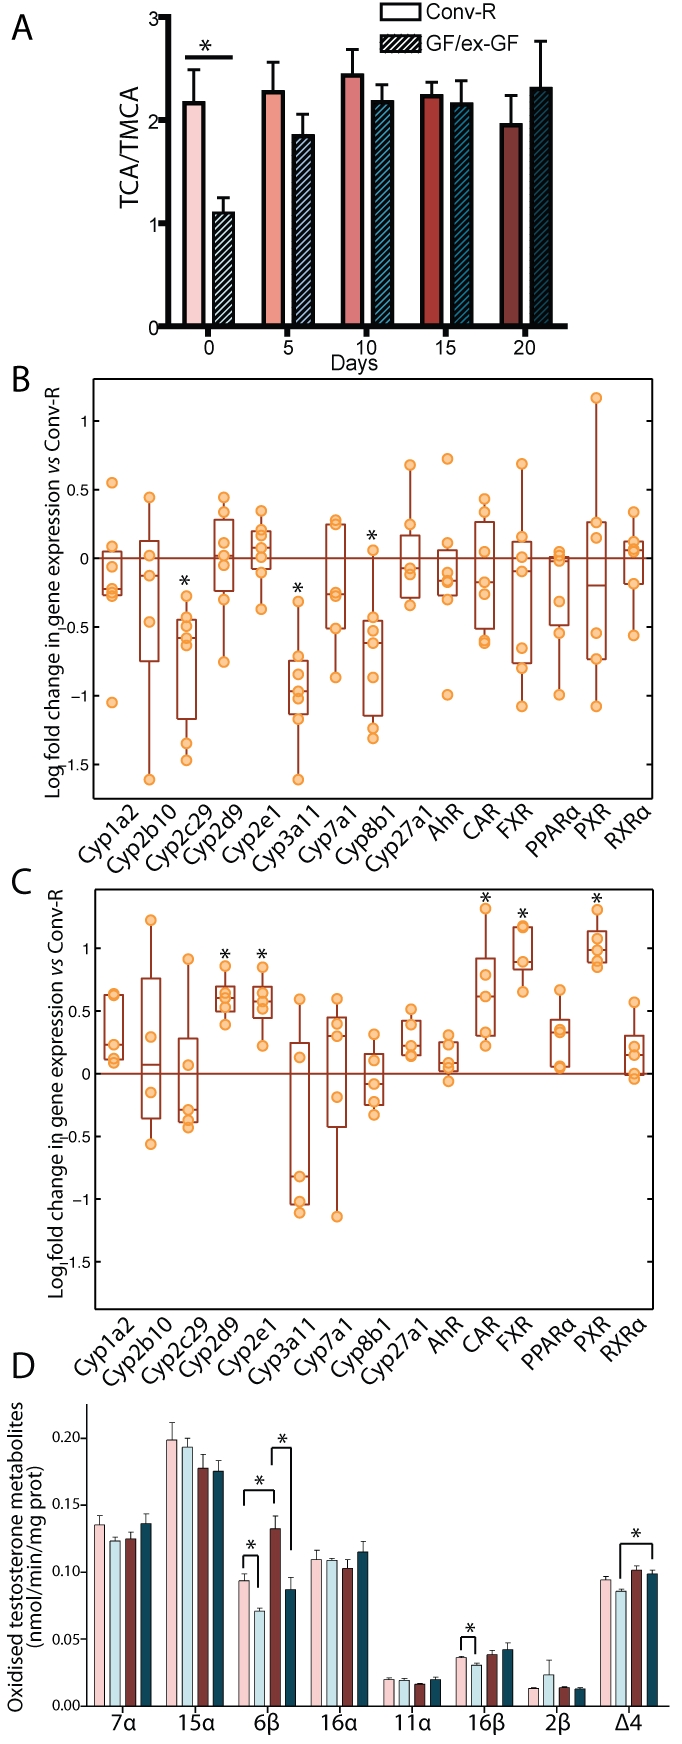
Gut microbiota influences cytochrome P450 expression and activity in liver microsomes. (A) Relative quantification of TCA over TMCA in bile over the acclimatization process. (B) mRNA expression levels of CYPs and nuclear receptors in GF mouse microsomes at D0 expressed relative to those of Conv-R animals (orange line). (C) mRNA expression levels of selected CYPs and nuclear receptors in ex-GF mouse microsomes at D20 expressed relative to those of Conv-R animals (orange line). (D) Profile of oxidized metabolites of testosterone in liver microsomes after 30 min of incubation. Data are means ± standard errors of the means. Symbols: light pink bars, Conv-R animals at D0; light blue bars, GF animals at D0; dark red bars, Conv-R animals at D20; dark blue bars, ex-GF animals at D20. *, P < 0.05 (Student’s t test).