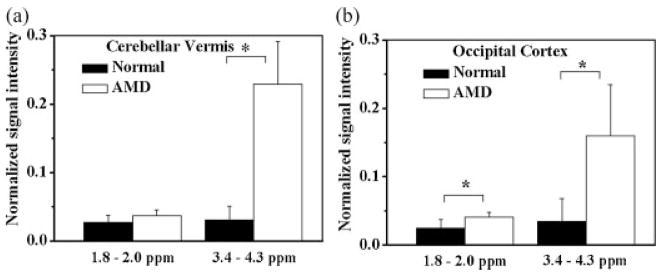
Figure 2.
Normalized signal intensity (peak area/water area ratio) of the resonances at 1.8–2.2 and 3.4–4.3 ppm regions from the cerebellar vermis (a) and occipital cortex (b) regions of normal and AMD cats. A significant increase in signal intensity from AMD animals due to increased oligosaccharides (3.4–4.3 ppm region) and due to NAA +Glc-NAc (1.8–2.2 ppm region) is apparent. * indicates significant differences between the two groups (p <0.01).

