
Figure 5.
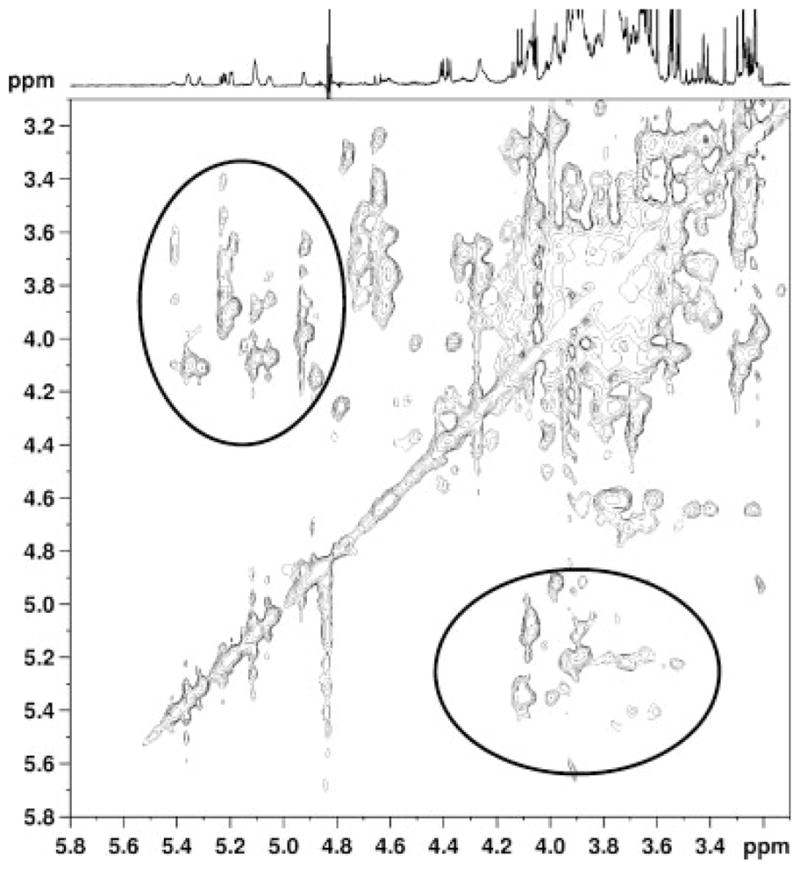
2D-TOCSY spectrum from the of brain extract of an AMD cat. Two prominent groups of cross peaks are observed, those close to the diagonal connecting carbohydrate ring protons in the 3.4–4.3 ppm region, and those connecting the carbohydrate ring protons to the anomeric oligosaccharide protons in the 4.6–5.4 ppm regions (circled).