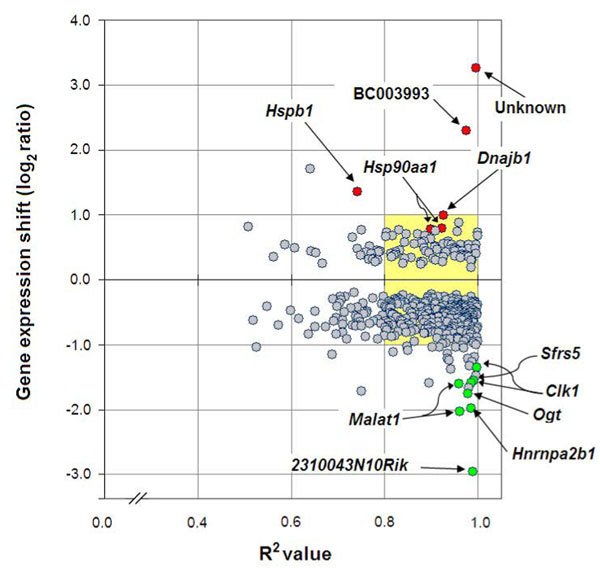
Figure 2.
Strength of OTF correlation as a function of ovarian gene expression shift The squared correlation coefficient (R2) for the 425 clones positively and negatively correlated (adjusted p<0.05) with ovarian tumor frequency (OTF) were plotted against their respective gene expression shifts. The shift is defined as the resultant of the subtracted gene expression log2 ratios between extreme values (see Table 1 and Additional file 1, 2, 3 Results file).

