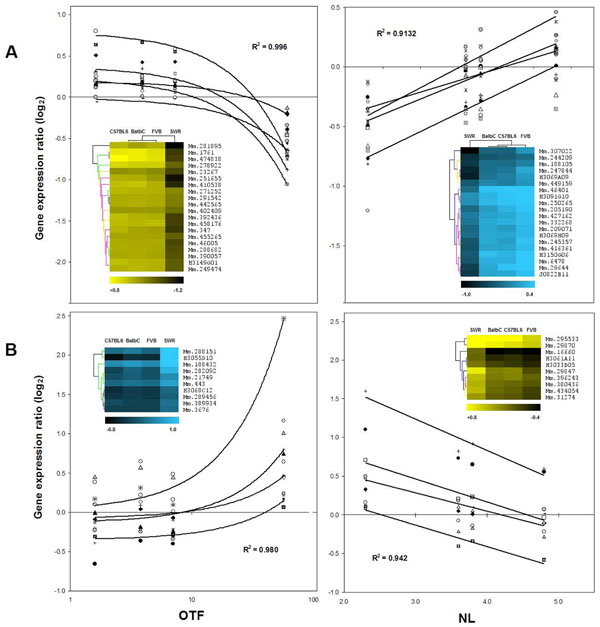
Figure 3.
Ovarian gene expression correlated to OTF and NL The gene expression ratios of the top-20 OTF(-), NL(+) best correlated clones (A) and the top-10 OTF(+), NL(-) best correlated clones (B) are plotted against their respective phenotypic variables. The average of squared correlation coefficients and four representative tendency lines are shown in each plot. Insets show hierarchical clusters for genes (vertical trees) and samples (horizontal trees). Yellow clusters represent negative correlation and blue clusters represent positive correlation. Color scales and Unigene IDs are shown at the bottom and right side of each cluster, respectively. Unknown clones appear with the NIA-15K clone code.

