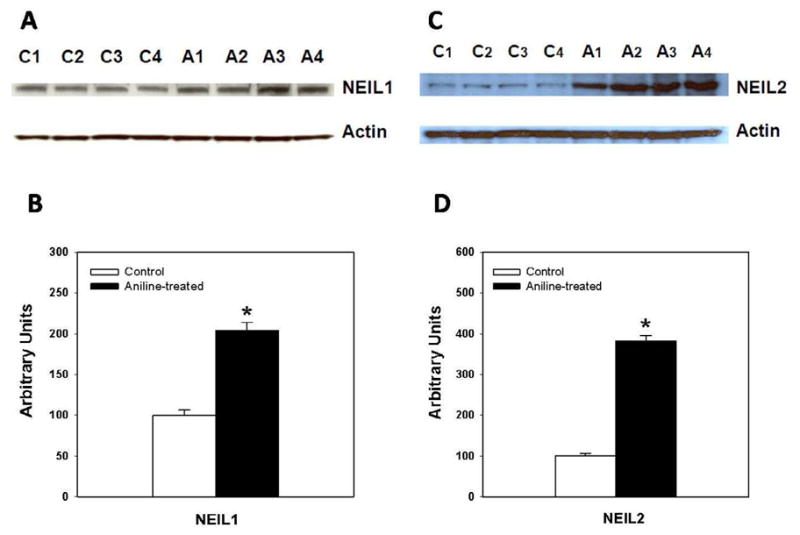
Fig. 3.

Western blot detection of NEIL1(A) and NEIL2 (C) in the NEs from control and aniline-treated rats. Lanes C1–C4: controls; lanes A1–A4: aniline-treated. Densitometric analyses of NEIL1 and NEIL2 bands from control and aniline-treated rats (B, D). The densitometric analysis of the protein bands was done using Eagle Eye II software. Data from aniline-treated spleen samples were statistically compared to untreated controls, which were arbitrarily set at 100. Values are means ± SD of four determinations. Protein expression of NEIL1 and NEIL2 in aniline-treated rats was 2.0- and 3.8-fold higher, respectively, in comparison to controls. *p < 0.05.
