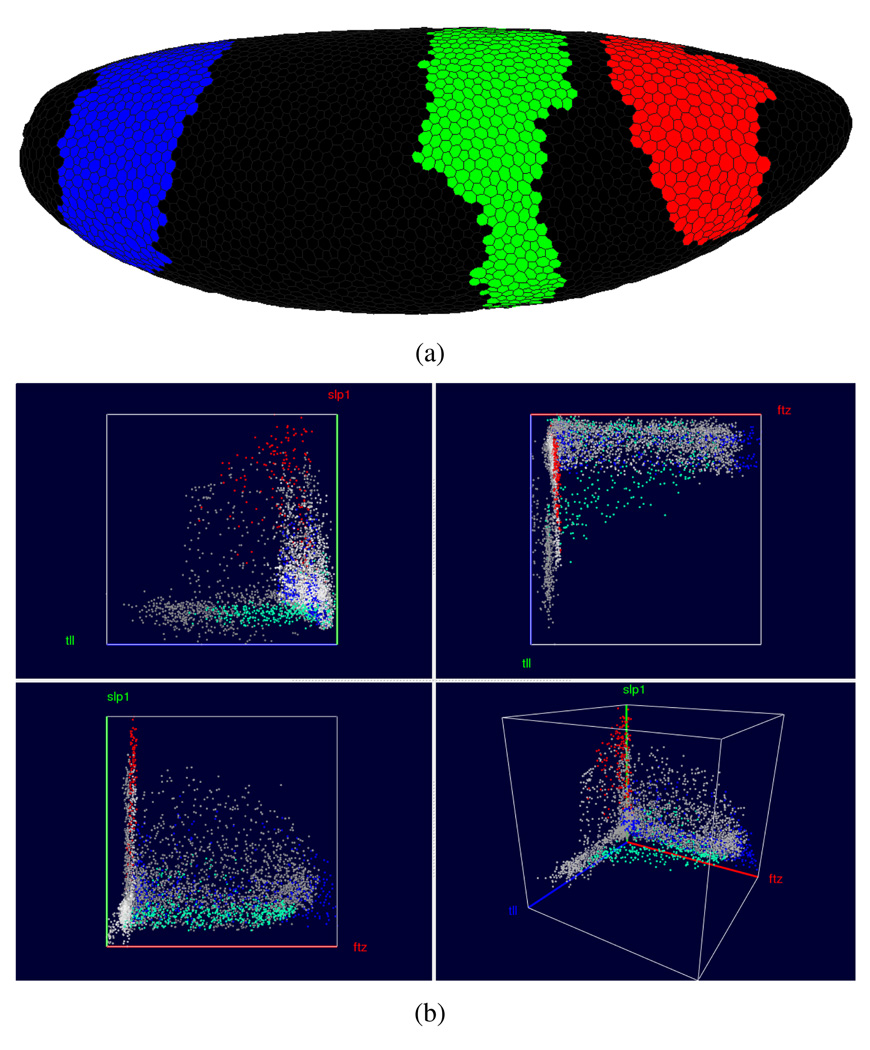
Fig. 10.
Cell Selection in the embryo view. In the embryo view it is possible to “paint” the three hb domains, assign them to three distinct Cell Selectors and show them in three distinct colors. By linking these selections to a Scatter Plot view (here showing ftz, slp1 and tll) a user can determine how these genes are expressed differently within the individual domains.

