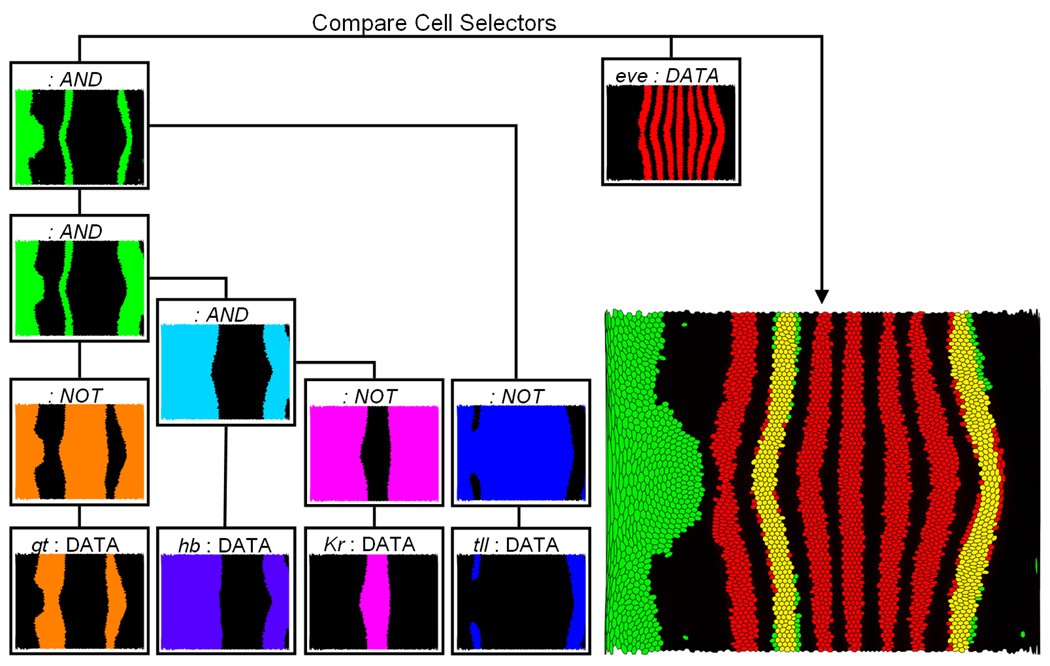
Fig. 13.
Using logical operations to examine regulatory relationships for eve stripe 2 and 7. The expression patterns of giant (gt), hunchback (hb), Krüppel (Kr), and tailless (tll) are first classified by defining an independent Cell Selector in Scatter Plots (DATA cell selector) for each gene. Subsequently, the Cell Selectors defining the gt, Kr, and tll patterns are inverted using a NOT operation. Afterwards these Logical Cell Selectors as well the Cell Selector defining the hb pattern are combined using a sequence of AND operations. In this way the overlap of the hb expression pattern, and the inverted gt, Kr, and tll expression patterns can be determined. The result (green) is compared to the eve expression pattern (red) identified by another DATA Cell Selector.

