Fig. 9.
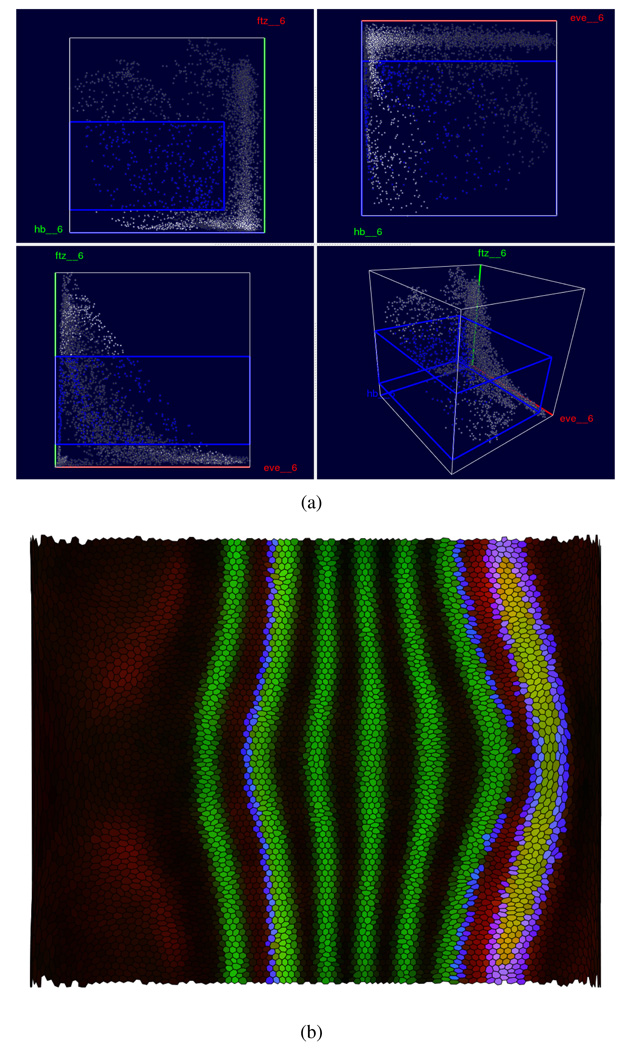
Cell Selection and Linking allow a user to relate different views to each other. For example, it is possible to select a subset of cells based on expression levels of three genes, such as eve, ftz and hb in a Scatter Plot View (a) while highlighting the same cells in a Physical View, such as the Unrolled View (b) to show their spatial distribution.

