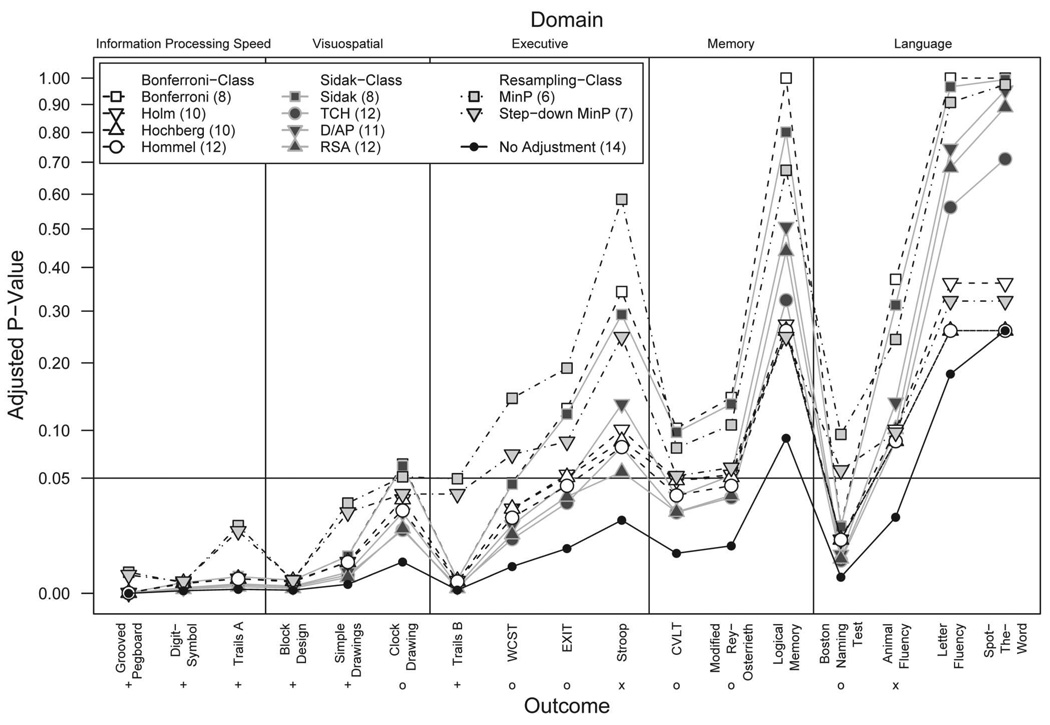
Figure 1.
Adjusted p values by method across neuropsychological outcomes. There are 17 observed p values for a set of 17 neuropsychological measures and adjusted p values per each method. A square-root scale is used to reduce overlapping points. Numbers in parentheses in the legend indicate the number of rejected hypotheses for that method. Symbols for outcomes with a null hypothesis rejected without adjustment indicate the following: + = null hypothesis rejected using each adjustment method; x = null hypothesis not rejected using any adjustment method; o = null hypothesis rejected by some adjustment methods. A full color version of this figure is included in the supplemental materials online.

