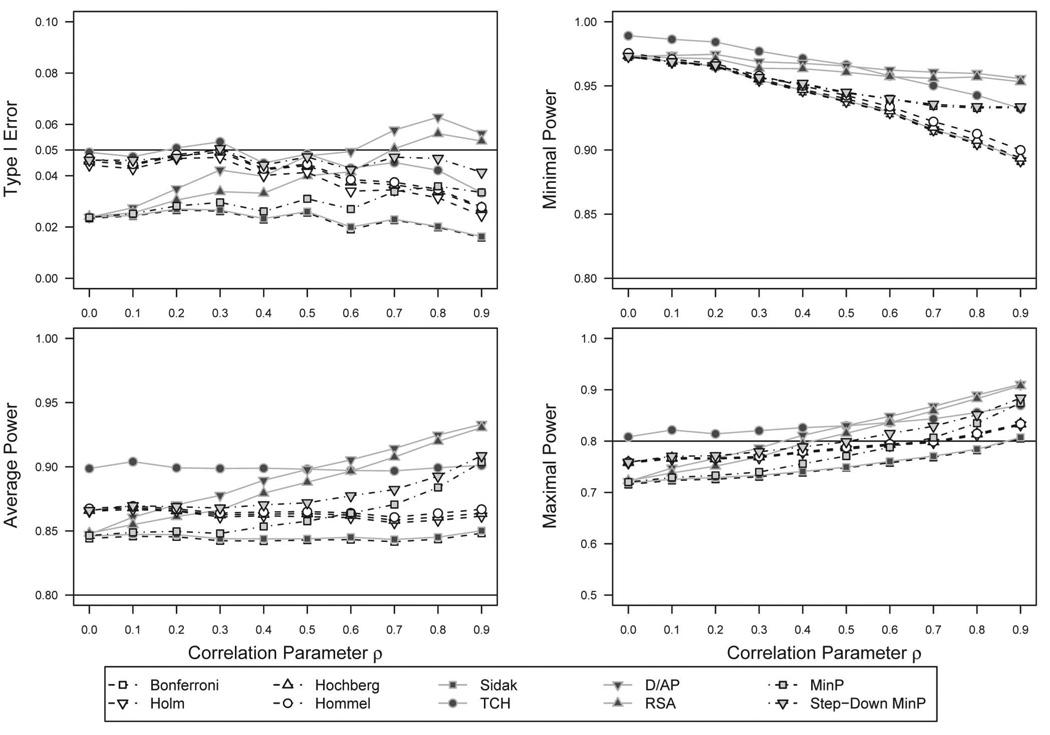
Figure 3.
p value adjustment method performance across compound-symmetry correlation structures, Type I error, and power estimates for split hypothesis set. The upper left panel shows Type I error rates of the p value adjustment methods across increasing values of the CS correlation parameter ρ. In this case, all only two of the M = 4 hypotheses are simulated to be true. Values near α = .05 are optimal. Values well above α = .05 indicate failure to protect Type I error at α. The remaining panels show different measures of power, using the two hypotheses simulated to be false. Higher power is optimal, conditional on Type I error not exceeding α. A full color version of this figure is included in the supplemental materials online.

