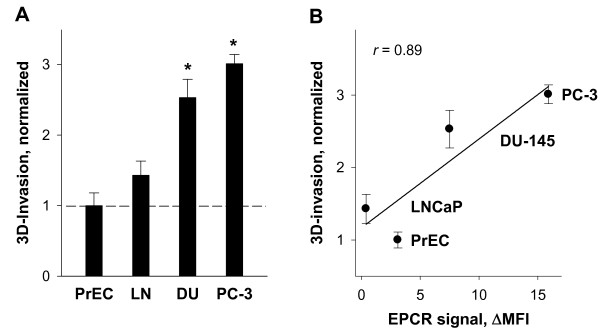
Figure 2.
Invasiveness of prostate cancer cells (A) and its correlation with EPCR expression (B). (A) Data bars represent the relative invasion activity of normal PrEC and malignant LNCaP (LN), DU-145 (DU), and PC-3 prostate cell lines measured in 3D cell invasion assay (Oris™). Serum starved cells were seeded onto basement matrix extract coated plates. Following 48 hr incubation, cells were labeled with Calcein AM and the fluorescence in the analytic zone was quantified using a plate reader, Victor3 1420 Multilabel Counter. Data are expressed as changes relative to PrEC cell migration which was assigned a value of 1.0. Results are the means ± SDs of analyses in quadruplicates and are representative of two independent experiments (B) Correlation of invasion activity and EPCR-specific immunostainings in PrEC and prostate cancer cell lines. Correlation coefficient was calculated using SigmaPlot 11 (Systat software, Inc.).

