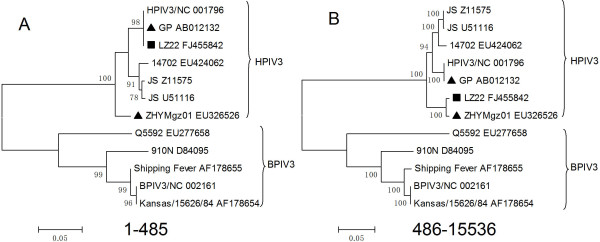
Figure 2.
Phylogenetic profiles of separate regions of LZ22_FJ455842 partitioned by cross-over events. The scale corresponds to the number of nucleotide substitutions per site. The percentage of replicate trees in which the associated taxa clustered together in the bootstrap test (1000 replicates) is shown next to the branches (only N > 70% is shown). The putative recombinants were showed with "black square". The putative parent lineages were marked with "black triangle". (A) and (B) respectively represent the phylogeny of pre- (1-485) and post- (486-15536) part of complete segments delimited by the breakpoint. The pre-part of mosaics demonstrated higher level of congruence with the GP lineage, while the post-part converge with ZHYMgz01_EU326526.

