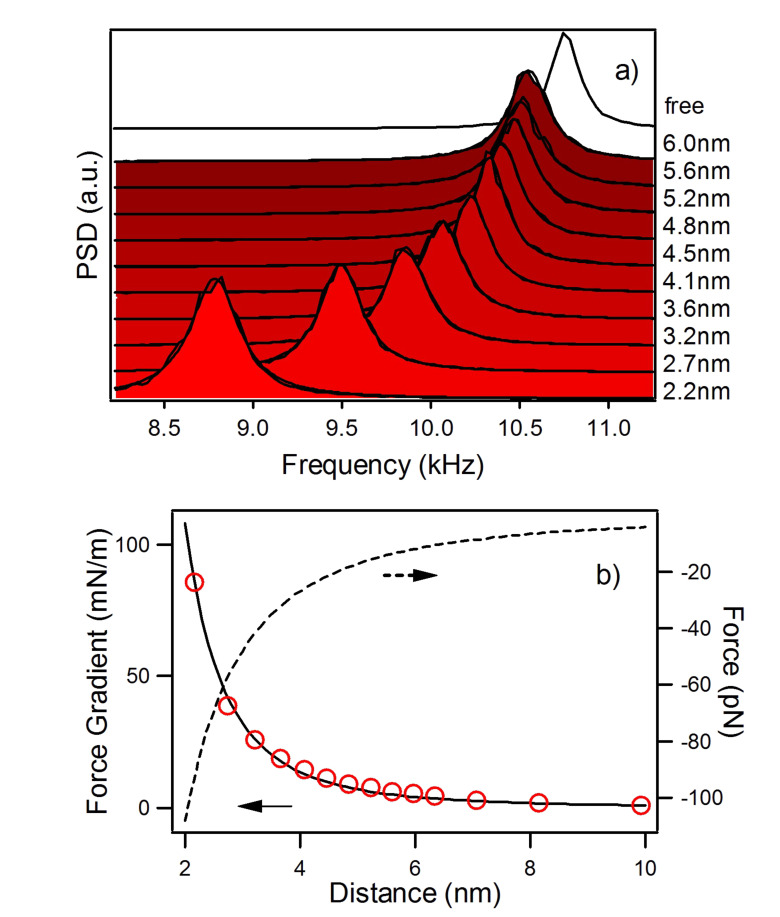
Figure 2.
Results from the Fourier transform method, adapted from [9]. a) Power spectral density of the thermal fluctuations of the first flexural mode of the cantilever acquired at different tip-sample separations. A negative frequency shift of the resonant frequency is observed on approaching the graphite surface. The resonance peaks are fitted with a Lorentzian. b) The black continuous line is a fit of the van der Waals force gradient between a spherical tip and a flat surface (force gradient = HR/3z3, z is the tip-sample distance) to the measured frequency shift of the first flexural mode as a function of the tip-surface separation (red circles). The dashed line is the interaction force obtained by integration.

