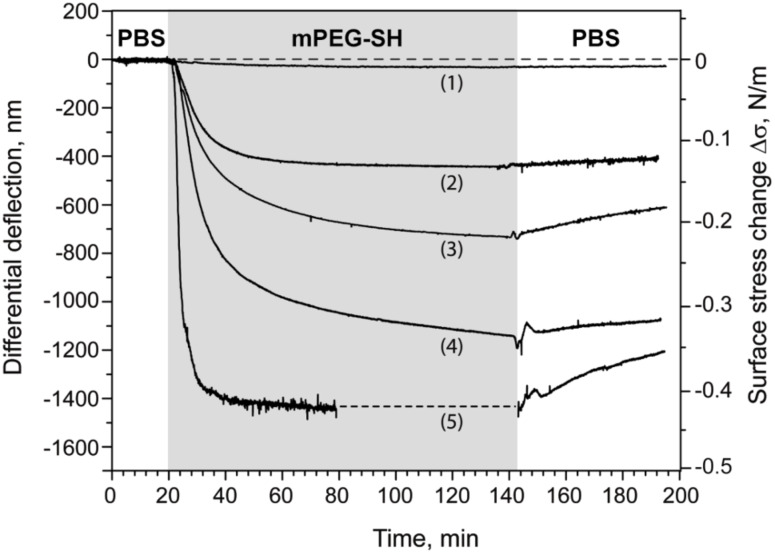
Figure 3.
Concentration-dependent grafting of mPEG–SH on Au: overlay view of five binding curves. The grey area indicates the period of injection of mPEG–SH solution. The binding curves were obtained at mPEG–SH concentrations of 0.5 μM (1), 10 μM (2), 50 μM (3), 100 μM (4) and 500 μM (5). Each curve was obtained by subtracting the response of the reference cantilevers from at least two sensing cantilevers from within the same array. The resulting five curves were further normalized with respect to the mechanical properties of the cantilevers used (see Material and Methods section). The dashed line in the curve (5) is the extrapolated saturation signal.

