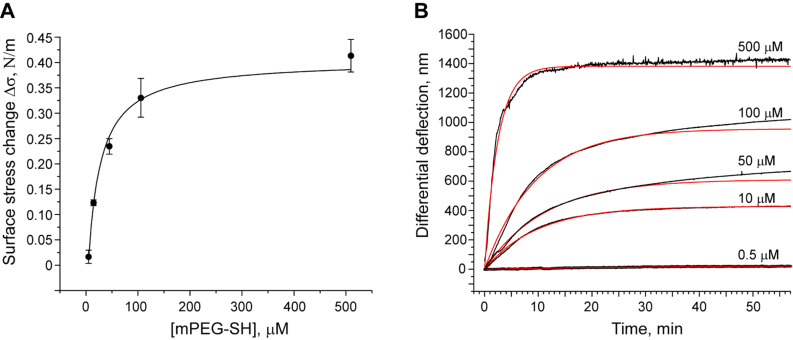
Figure 4.
(A) Adsorption isotherm of mPEG–SH on Au. Each point (circle) corresponds to the maximum differential signal observed at the following mPEG–SH concentrations: 0.5, 10, 50, 100 and 500 μM. The solid line represents the Langmuir isotherm fitting curve (R2 = 0.982). (B) Representative plots of microcantilever deflection versus time. Kinetic curves (black) were fitted using the exponential Langmuir rate law (red). The curves were fitted for the first 30 min of the binding event and then extrapolated for a longer period of time.

